I’m a big music nerd and I do subscribe to multiple music streaming services. Among them is Spotify. Every year around December, Spotify releases Spotify Wrapped, a compilation of statistics around your listening habits. Unfortunately, Spotify Wrapped centers around data from the past year.
However, since I have been subscribing to Spotify for several years, I was curious to dive deeper into my music listening habits. I discovered that there is a possibility to retrieve all personal data that is collected and decided to make my own enhanced Spotify statistics using all available data. I ended up with a Python package that prepares your data and functions as the backbone to a simple Flask app used to visualize your statistics. Most importantly, the project tracks no data and runs completely on your local machine. If you’d like to skip to the fun part, here is the link to the GitHub repo.
Project set-up
The repos README provides in-depth instructions on how to set up the project. Nevertheless, I’ll briefly describe the two most important requirements in order to get your app up and running. For one you’ll need your listening history and a Spotify developer access.
To retrieve the data, write an e-mail to privacy@spotify.com and request your streaming history. After two days I got a confirmation mail, stating that my data is being collected. After another 12 days Spotify provided me a download link for my data (a bunch of json files). The project includes a function to concatenate all relevant json files to a single data frame.
To get development access, visit the Spotify developer site as you will need access to the Spotify Web API. Log in with your Spotify account and click on Dashboard. Here you have to create an app. Provide an app name and description. After creation, you will get a client ID and client secret. The Python package spotipy (used to retrieve album covers) requires these credentials.
With both requirements on hand you are ready to go. Of course, you can use bits and pieces of the project. However a Dockerfile is provided and Docker might be the fastest way to get your enhanced stats.
The app
As mentioned, a simple flask app is included and functions as an interface to browse your stats.

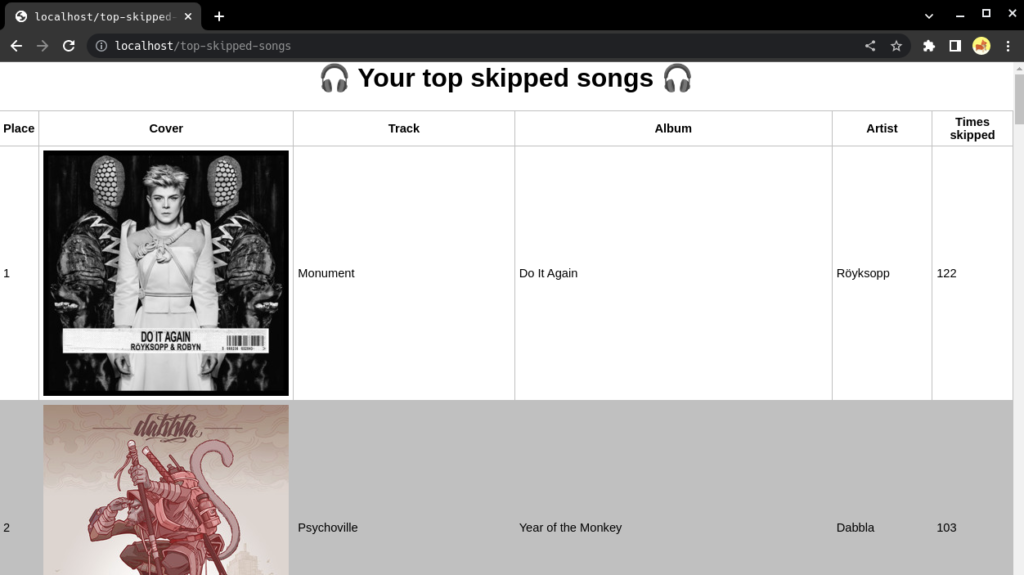
As pictured, the app displays your top artists, songs and albums over the entire period of your Spotify subscription. Moreover, you can have a look at the songs you skipped the most.

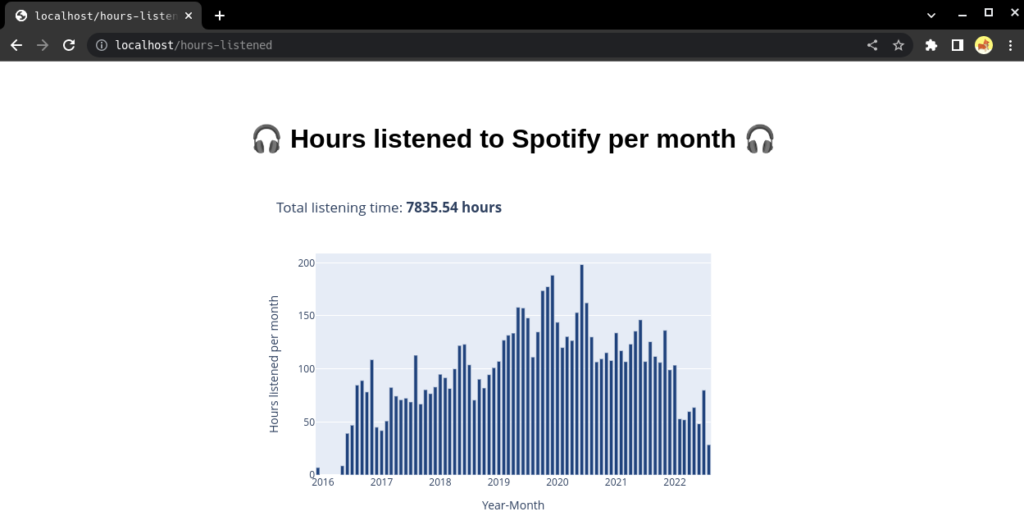
Lastly, the app provides an overview of how many hours per month you streamed music.

For now, the project manages to provide a detailed look into the listening habits and is a nice addition to Spotify Wrapped. Yet, not nearly everything has been extracted from the data. Therefore, some additional features might be added in the future, such as retrieving music genres and visualizing the music taste over time. Furthermore, a more dynamic interface would benefit the app. If you have any ideas/suggestions for the project or you found some bugs, feel free to message me. You can find my contact details on the Contact page. I’d love to hear from you! 😀
– Jakob